Decarbonisation of the transport sector
Reconciling prosperity and climate-friendly mobility
We investigate the economic impact and the emissions savings potential of a decarbonisation pathway for the Swiss transport sector based on three scenarios and a combination of them: (1) improved fuel/engine technology and fostered diffusion of battery electric vehicle, (2) increased occupancy rate of passenger cars, and (3) enhanced modal shift towards public transport.
The optimal decarbonisation mix pathway until 2050 slightly increases welfare and lowers CO2 emissions of passenger transport in 2050 from 6 to 1.7 million tons CO2 compared to the reference scenario. In order to reach full decarbonisation, a ban on fossil-fuelled vehicles is crucial in addition to economic measures. It not only accelerates the penetration of battery-electric cars, but also provides planning and investment security for the production and purchase of vehicles.

Background
In Switzerland the transport sector considerably contributes to the greenhouse gas emissions, and is, contrary to other sectors, not yet on an emission reduction path. In order to mitigate climate change in the transport sector, a vast decarbonisation is vital. Thus, this project fills a research gap by developing and analysing different decarbonisation scenarios of the transport sector in Switzerland and its economic impacts. The focus of the project lays on passenger transport. The scenarios are analysed using a multi-model framework, linking a computational general equilibrium model with two external transportation models.
Three general approaches to reduce GHG emissions are distinguished (Ökoinstitut et. al. 2016):
- Improved technology: Improving fuel efficiency, motor vehicle efficiency towards low-carbon and zero-carbon technologies.
- Increased occupancy rate: Increasing vehicle efficiency (capacity use and load factors).
- Modal Shift: Modal shift and multimodal use of other (less carbon intensive) transport modes such as railways, new transport systems, cycling, etc
Aim
The research project of the Swiss National Science Foundation (or: NRP 73) continues on this path and attempts to answer the following questions:
-
Which economic effects do specific approaches to decarbonisation have on Swiss passenger transport systems?
-
Which combination of specific decarbonisation strategies has the most favourable economic effects for Switzerland?
-
Which instruments are necessary to decarbonise passenger transport with the best ratio of economic and ecological effects?
Results
The analysis of the main strategies shows that no single approach alone can achieve the targeted decarbonisation of passenger transport. Following the analysis of the models on economic effects, we therefore tested combinations of the three approaches that can attain the targeted decarbonisation with the most favourable economic effects. This optimisation analysis was realized with the model using the combination of all variants of the three approaches. It resulted in a benchmark curve.
The main results of these optimisation steps in the three scenario analyses show clearly:
-
Decarbonisation of transport with positive economic effects is possible. Moreover, the external costs of transport are reduced thanks to the decarbonisation strategy, requiring lower adjustment costs and mitigation efforts.1
-
The technical approach for the electrification of vehicles is very important, but alone it clearly fails to attain the targeted decarbonisation. Additional efforts are required in terms of efficiency and optimisation, meaning an optimal combinationof the three approaches mentioned above.
-
Even the optimal combination of the three analysed approaches will not yet lead to a complete decarbonisation of transport in Switzerland. The targeted contribution is 80% by 2050.
-
More stringent measures above and beyond this are necessary. In order to more rapidly attain the most important strategy element in terms of emissions – promotion of battery-powered electric transport – an additional ban of vehicles using fossil fuels (combustion ban) is necessary. This brings investment security in the production and purchase of vehicles and will lead to an accelerated market saturation of e-vehicles. The 2050 climate-neutrality target can be attained togetherwith the elements of the three approaches.
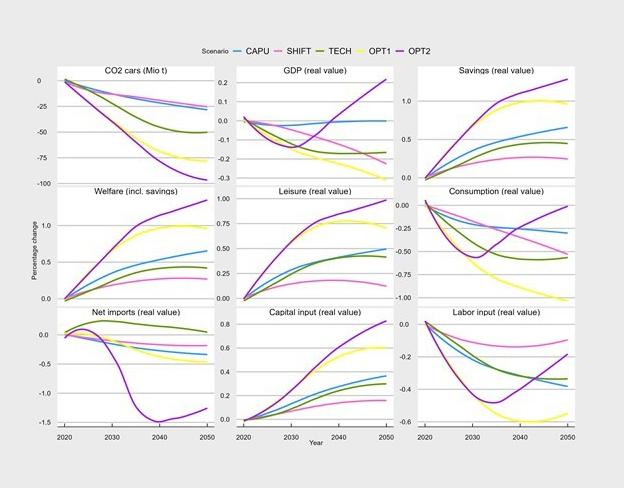
The following table and subsequent graph show the most important economic effects quantified in the model.
The final economic indicator is social welfare; it consists of real income/GDP and benefits of increased leisure and opportunities due to a reduction of transport demand.
1 We always assume here that the necessary efforts will be done in other countries, resulting in a global contribution.
Table 1: Main results of the model analyses of decarbonisation of private transport until 2050
| Indicator / Value 2050 | Reference | Scenario 1 | Scenario 2 | Scenario 3 | OPT 1 | OPT 2: |
|
| “BAU” | “CAPU” | “SHIFT” | “TECH” | “Combina-tion” | “OPT 1 plus ban” |
| Number of private cars | 5.2 Mio. | 3.7 Mio. | 3.8 Mio. | 5.2 Mio. | 2.7 Mio. | 2.7 Mio. |
| Share E (BEV) of total cars | 35% | 35% | 35% | 65% | 65% | 96% |
| Energy needs BEV (TWh) | 5.1 | 3.6 | 4.5 | 9.7 | 5.2 | 6.6 |
| Net import of electricity (TWh) | 7.0 | 5.0 | 5.6 | 9.9 | 5.6 | 6.7 |
| transport performance, motorised individual transport (pkm) | 110 Bn. | 110 Bn. | 86 Bn. | 106 Bn. | 76 Bn. | 74 Bn. |
| transport performance, public transport (pkm) | 37 Bn. | 38 Bn. | 60 Bn. | 38 Bn. | 63 Bn. | 47 Bn. |
| CO2 emissions in private | 5.4 | 3.9 | 4.0 | 2.7 | 1.1 | 0 |
| transport Mio. t (in % to reference) |
| (-28%) | (-25%) | (-50%) | (-79%) | (-100%) |
| Share of work transport (business and commuter), compared to BAU |
| -0.4% | -0.1% | -0.4% | -0.5% | -0.2% |
| Share of leisure transport, compared to BAU |
| +0.5% | +0.1% | +0.4% | +0.7% | +1.0% |
| Actual per capita consumption, compared to BAU |
| -0.3% | -0.5% | -0.6% | -1.1% | 0% |
| Actual net import, compared to BAU |
| -0.3% | -0.2% | 0% | -0.5% | -1.3% |
| Savings compared to BAU |
| +0.7% | +0.2% | +0.4% | +1.0% | +1.3% |
| Actual GDP compared to BAU |
| 0% | -0.2% | -0.2% | -0.3% | +0.2% |
| Actual social welfare comp. BAU |
| +0.7% | +0.3% | +0.4% | +1.0% | +1.4% |
BAU: business-as-usual,
CAPU: increase of capacity use,
SHIFT: modal shift towards public transport,
TECH: improved fuel/engine technology and fostered diffusion of battery electric vehicle,
OPT1/OPT2: optimal scenarios. OPT1 combines the specific approaches of the scenarios; OPT2 includes a ban of fossil fuels in order to reach the CO2 target
BEV battery electric vehicles
pkm: passenger kilometres
TWH: terawatt hours.
Table INFRAS/ETHZ.

Figure 1: Selected presentations of the key criteria of the scenarios for decarbonisation of private transport by 2050.
Implication for research
In this project, we develop a comprehensive economic model that includes a highly disaggregated passenger transport sector for Switzerland. The scientific contribution and uniqueness of our approach are:
- Combining transportation models with a CGE-Model
- The expansion of economic indicators beyond GDP and the integration of leisure (which also expands the classic value-added approach).
- The optimisation approach from edge case scenarios to optimal combinations.
- Explicit modelling of the important sector coupling “transport – production of renewable energies”.
Implication for practice
The results are directly useful for the climate policy debate in the field of transport. It is evident that the economic dimension must be extended from a classic GDP approach to a universal indicator of welfare in order to include all aspects. It becomes apparent that economically beneficial measures to increase capacity, but also bans, can be effective in finding the optimum position between efficiency and effectiveness. This means that in order to decarbonise the transport sector not only economic instruments are needed but a mix of instruments.
Publikationen
Project leaders
Markus Maibach
INFRAS
Martin Peter
Managing Director INFRAS


